Stop, Drop, and Stay the Course
How To Invest Markets & EconomyWes Crill, PhD
Senior Client Solutions Director and Vice President, Dimensional Advisors
For many of us, the importance of a fire drill is ingrained starting as early as elementary school. The procedure of reacting to an alarm by calmly exiting the building is repeated to build muscle memory for what to do in a real emergency. Just as importantly, it cements lessons on what not to do. For example, I don’t think the saying goes: “Stop, drop, and grab a coffee before riding in the elevator.”
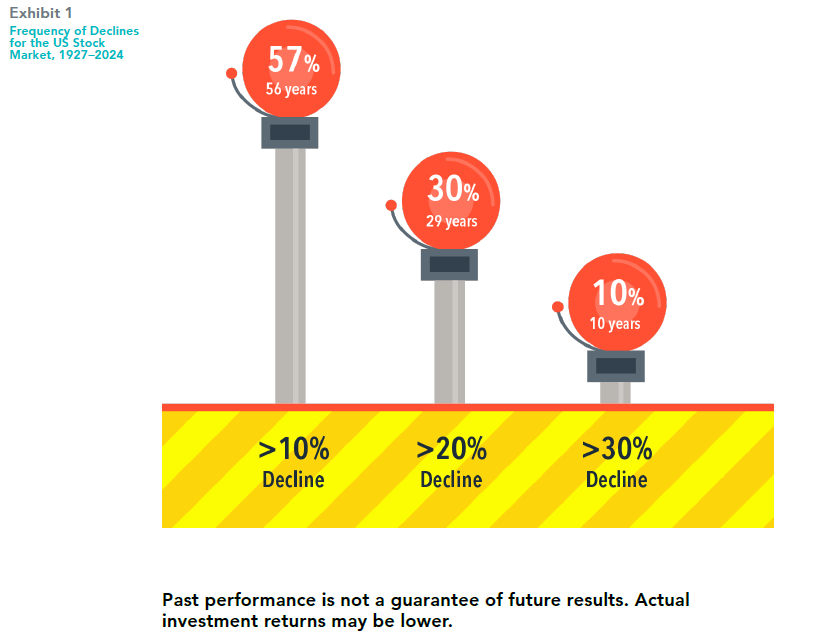
The concept of a fire drill is relevant to investing too. Knowing the range of possible outcomes, and how to behave in those circumstances, is critical to success for the longterm investor. The odds are that investors will be tested with a downturn. US stocks have experienced a downturn of at least 20% at some point during 29 of 98 calendar years since 1927.
It’s important to keep in mind that a bad stretch doesn’t mean a bad year to come. While a 20% slide occurred in 29 years, only six times did the market end up below −20% for the full year. And the market actually posted positive full-year returns in 10 of those 29 years. This reinforces the lesson that the most reliable course of action following a market downturn is to remain invested.
We can’t control—or predict—market drops. What we can do is avoid compounding losses by reacting. Fire drills save lives. Financial fire drills may help save our savings.