

Midyear Review: Stocks’ Climb Is Challenged During Volatile First Half
How To Invest Markets & EconomyArticle from Dimensional
KEY TAKEAWAYS
- The S&P 500 recouped earlier losses and was slightly higher near the year’s midway point.
- Market volatility returned in April, approaching levels not seen since 2020 and 2008.
- Value stocks outperformed growth stocks globally, but small caps lagged large caps.
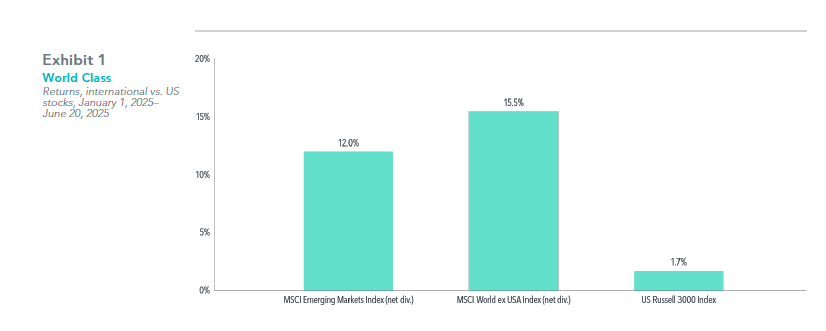
Markets took investors on an up-and-down ride during a volatile first half of the year, with notable swings coming amid uncertainty about the impact of tariffs on the US and the global economy. In the US, while the S&P 500 hit new highs in February, it also posted sharp falls in April, before rebounding in May to end slightly higher as of June 20.1 In a reversal of trends in recent years, developed international equity markets outpaced the US, as did emerging markets (see Exhibit 1). The US Federal Reserve held interest rates steady, citing risks of higher inflation and a rise in unemployment. In the bond market, US Treasuries were higher, with the benchmark 10-year yield just below 4.3%.2
Past performance is not a guarantee of future results.
Sources: MSCI Emerging Markets Index (net div.), MSCI World ex USA Index (net div.), Russell 3000 Index. MSCI data © MSCI 2025, all rights reserved. In USD. Indices are not available for direct investment. Their performance does not reflect the expenses associated with the management of an actual portfolio.
The new US presidential administration took office in January, later threatening or imposing tariffs on goods from a number of countries. The S&P 500 then fell by a combined 10.5% on April 3 and 4, marking the biggest two-day drop since the onset of the COVID-19 pandemic in March 2020. But, just a week later, on April 9, the index rose by 9.5% when the administration announced a 90-day pause on tariffs. Stocks subsequently continued their upward trend amid policy shifts and delays implementing tariffs.3
The Fed kept the federal-funds rate unchanged in the 4.25%–4.5% range in May and June, but officials warned that uncertainty about the economic outlook remained elevated.4 On inflation, the US core consumer price index, which excludes more-volatile food and energy items, showed prices rose 2.8% from a year earlier in May, the most recent data available—higher than the Fed’s target rate of 2%.5
Investors also turned their attention to gold, whose price has risen 25.2% this year as of May 31, the most recent data available.6 Some may believe gold can be a useful tool for protecting wealth from rising prices or a safe haven to stabilize a portfolio when stocks are volatile. But gold hasn’t been effective at tracking inflation and has been far from immune to downturns. In fact, since 1970, gold has had a positive annual return in just 60% of calendar years, while the S&P 500 Index has had a positive return in 80%. For investors, this pattern raises questions about the long-term benefits of an allocation to gold.7
Approaching the year’s halfway point, the S&P 500 Index was up 2.1% and the tech-heavy Nasdaq was ahead 1.0%. Both indices at one point in April had fallen 20% from their previous highs. Global equities, as measured by the MSCI All Country World Index, rose 6.2% as of June 20, even amid conflict in the Mideast that escalated in mid-June. Developed international stocks rose 15.5%, as measured by the MSCI World ex USA Index. The MSCI Emerging Markets Index gained 12.0.%.8 The outperformance of international markets is further evidence of the benefits of global diversification. Holding equities from markets around the world—as opposed to those of a few countries or just one—positions investors to potentially capture higher returns wherever they may appear.
In the bond market, US Treasuries were 2.8% higher, sending the yield on the benchmark 10-year Treasury bond down to 4.28%.9 The broader bond market was also higher, with the Bloomberg US Aggregate Bond Index up 2.9% and the Bloomberg Global Aggregate Bond Index (hedged to USD)—a broad benchmark of sovereign and corporate debt—climbing 2.3% as of June 20.10 This is a reminder that bonds issued indifferent countries can offer a range of yields and expected returns, potentially benefiting investors who diversify across bond markets globally.
VALUE TOPS GROWTH
Value stocks, or those with low relative prices, outperformed growth stocks in the US and globally through late June. The MSCI All Country World Value Index rose 7.9% versus the 4.5% increase for the MSCI All Country World Growth Index, and the MSCI All Country World ex USA Value Index added 17.0% versus the 12.0% gain for the MSCI All Country World ex USA Growth Index. But small cap stocks lagged large caps in the US and globally. The MSCI All Country World Small Cap Index returned 4.3% versus 6.2% for the larger-cap MSCI All Country World Index, while the MSCI All Country World ex USA Small Cap Index rose 13.2% versus the 14.5% gain for the MSCI All Country World ex USA Index.
As with small cap stocks, the stocks of companies with high profitability underperformed the stocks of companies with low profitability in both developed markets and emerging markets. The Fama/French Developed High Profitability Index was 3.3% higher versus 8.8% for its low-profitability counterpart as of May 31, the most recent data available. The Fama/French Emerging Markets High Profitability Index rose 5.3%, while its lowprofitability counterpart gained 7.0% as of May 31.11
TURBULENT TIMES
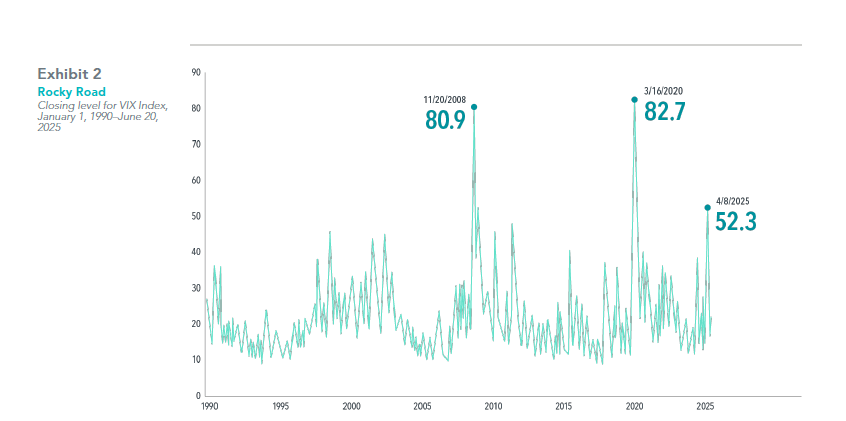
With the return of significant volatility in the first half of 2025, the S&P 500 moved at least 2 full percentage points on eight separate days in April. Meanwhile, the VIX Index, a common measure of US stock market volatility, spiked to levels not seen in years, peaking at 52.3 on April 8.12 The last two times the VIX closed above 50 were the early days of the global pandemic on March 16, 2020, when it closed at 82.7, and during the height of the global financial crisis on November 20, 2008, when it closed at 80.9 (see Exhibit 2).
Past performance is not a guarantee of future results.
VIX Index data provided by the Chicago Board Options Exchange. ©2025 CBOE Exchange, Inc. All rights reserved. Indices are not available for direct investment; therefore, their performance does not reflect the expenses associated with the management of an actual portfolio.
Market volatility may be unnerving, but it is also a sign of a working market. Whether responding to economic forecasts, consumer price changes, or tariff policy updates, market prices adapt to new information. It would be surprising if markets didn’t have reactions that are reflective of impactful events. So while the news headlines may be concerning, market turbulence historically has subsided, giving investors good reason to resist making changes. Pain one may feel now reflects markets setting prices such that expected returns are always positive. So when the market experiences a sudden drop, remaining committed to a plan can help investors avoid day-to-day worries—and set them up for the long-term rewards that the market can offer.